All posts by admin

Che sorpresa ti aspetta nel vivace casinò lazybar: generosi bonus, giri gratuiti e una selezione di giochi colorati renderanno la tua serata fantastica.

Amtrak Timeliness Study Results

September, 2004

Michigan Association of Railroad Passengers (MARP) has conducted a timeliness study for AMTRAK trains serving the state of Michigan. The study period covers September 1 through September 30, 2004. Data for the study was obtained directly from AMTRAK’s website-based train status database.

Data was collected by four MARP members who were each assigned specific trains: Blue Water-Kaz Fujita; Pere Marquette-John Langdon; Wolverine eastbound-Jim Wallington; and Wolverine westbound-Mike Whims. MARP wishes to thank these members for their valuable efforts.

The study was prompted by continued complaints from passengers regarding AMTRAK’s timeliness performance. A preliminary study conducted by MARP in June-July, 2004 indicated serious timeliness delays, some of which were considered perhaps due to startup problems on the Blue Water and other non-recurring events. The September study is both a confirmatory study and a baseline against which future studies will be compared.

The results of the September study indicate that serious deficiencies exist in AMTRAK’s ability to deliver timely service on Michigan’s ten (10) daily trains. On average, an eastbound passenger could rely on reaching a train’s final Michigan destination city on-schedule only 36% of the time, and a westbound passenger could rely on an on-schedule arrival in Chicago only 9% of the time.

The September study results indicate that performance varies from train to train. The westbound trips are clearly less reliable than eastbound, and the somewhat subjective honor of the worst performance is shared by the Blue Water westbound and the Wolverine mid-day westbound #353 trains. In fact, anyone who rode the #353 Wolverine train never reached Chicago on time during September.

This report includes a summary sheet of performance data by train, followed by the actual data collected by each member. Although data format used by each member differs, a standard convention is utilized where (+) indicates lateness. Also, an early arrival is counted as on time in the summaries. A cancelled train (due to freight problems for instance) was not counted in the averaging.

      MICHIGAN ASSOCIATION OF RAILROAD PASSENGERS				
                 September, 2004 AMTRAK Timeliness Study Results				

BLUE WATER West #365 			Dp PTH	Dp LNS	Dp BTL	Ar CHI
% of time train met schedule		90%	20%	7%	3%
Ave. departure from schedule (min.)	0.8	32.8	45.0	71.8

BLUE WATER East #364 			Dp CHI	Dp BTL	Dp LNS	Ar PTH
% of time train met schedule		87%	10%	0%	30%
Ave. departure from schedule (min.)	7.5	27.4	37.6	39.4

PERE MARQUETTE West #371 		Dp GRR	Dp HOM	Dp NBM	Ar CHI
% of time train met schedule		100%	7%	3%	10%
Ave. departure from schedule (min.)	0.0	6.3	18.6	25.5

PERE MARQUETTE East #370 		Dp CHI	Dp NBM	Dp HOM	Ar GRR
% of time train met schedule		90%	28%	24%	31%
Ave. departure from schedule (min.)	0.4	14.3	16.3	14.3

WOLVERINE early West #351 		Dp PNT	Dp DET	Dp BTL	Ar CHI
% of time train met schedule		69%	0%	0%	10%
Ave. departure from schedule (min.)	5.1	18.9	33.1	32

WOLVERINE mid-day West #353 		Dp PNT	Dp DET	Dp BTL	Ar CHI
% of time train met schedule		38%	0%	0%	0%
Ave. departure from schedule (min.)	14.7	26.6	46.0	42.5

WOLVERINE evening West #355 		Dp PNT	Dp DET	Dp BTL	Ar CHI
% of time train met schedule		79%	18%	3%	23%
Ave. departure from schedule (min.)	7.5	19.6	30.4	28.3

WOLVERINE early East #350 		Dp CHI	Dp BTL	Dp DET	Ar PNT
% of time train met schedule		80%	17%	30%	30%
Ave. departure from schedule (min.)	9.8	25.3	29.5	31.9

WOLVERINE mid-day East #352 		Dp CHI	Dp BTL	Dp DET	Ar PNT
% of time train met schedule		83%	23%	17%	20%
Ave. departure from schedule (min.)	3.8	25.3	30.6	29.1

WOLVERINE evening East #354 		Dp CHI	Dp BTL	Dp DET	Ar PNT
% of time train met schedule		90%	20%	33%	30%
Ave. departure from schedule (min.)	1.1	15.6	15.1	16.3

Data source: AMTRAK

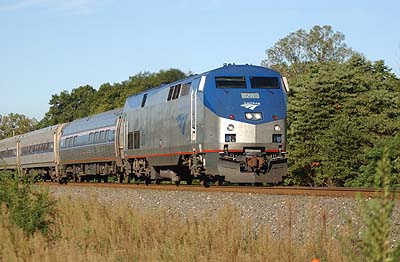
Amtrak – September 2004 ridership stats

 See below…


September FY04
                               
    Ridership   Ticket Revenue  
          % change vs.             % change vs.      
Short Distance FY04 FY03 Budget* FY03   Budget FY04 FY03 Budget* FY03   Budget
1 – Acela   218,449 204,700 205,142 +6.7 +6.5 $25,120,505 $23,220,467 $25,807,468 +8.2 -2.7
2 – Metroliner   17,626 52,791 53,190 -66.6 -66.9 $1,785,631 $5,473,039 $6,122,694 -67.4 -70.8
3 – Ethan Allen   7,644 8,104 8,100 -5.7 -5.6 $310,370 $317,291 $344,777 -2.2 -10.0
4 – Vermonter   18,059 18,589 19,133 -2.9 -5.6 $973,583 $937,016 $1,036,563 +3.9 -6.1
5 – Regional   503,079 463,068 517,700 +8.6 -2.8 $24,659,121 $23,132,317 $25,800,481 +6.6 -4.4
9 – Downeaster   20,557 19,215 20,022 +7.0 +2.7 $288,861 $292,557 $294,431 -1.3 -1.9
13 – Clocker   160,395 162,331 164,937 -1.2 -2.8 $1,451,154 $1,578,465 $1,662,491 -8.1 -12.7
14 – Keystone   72,025 70,462 76,705 +2.2 -6.1 $1,524,436 $1,571,760 $1,874,215 -3.0 -18.7
15 – Empire   80,905 83,508 87,036 -3.1 -7.0 $3,120,273 $3,260,874 $3,353,174 -4.3 -6.9
20 – Chicago-St. Louis   16,431 14,675 16,542 +12.0 -0.7 $327,090 $292,536 $316,827 +11.8 +3.2
21 – Hiawatha   37,875 35,365 34,419 +7.1 +10.0 $621,744 $585,794 $568,724 +6.1 +9.3
22 – Wolverine   27,279 24,057 24,890 +13.4 +9.6 $741,057 $701,220 $660,117 +5.7 +12.3
23 – Illini   9,896 8,289 9,126 +19.4 +8.4 $265,560 $235,058 $210,538 +13.0 +26.1
24 – Illinois Zephyr   8,235 7,910 8,552 +4.1 -3.7 $182,690 $178,621 $164,666 +2.3 +10.9
29 – Heartland Flyer   3,486 2,808 1,888 +24.1 +84.6 $61,346 $49,678 $33,247 +23.5 +84.5
35 – Pacific Surfliner   191,796 204,880 215,977 -6.4 -11.2 $2,856,777 $2,689,138 $2,871,139 +6.2 -0.5
36 – Cascades   47,974 45,386 49,503 +5.7 -3.1 $1,188,902 $1,107,638 $1,168,306 +7.3 +1.8
37 – Capitols   94,707 90,304 91,328 +4.9 +3.7 $1,037,899 $913,710 $937,028 +13.6 +10.8
39 – San Joaquins   53,500 56,132 57,269 -4.7 -6.6 $1,473,097 $1,673,678 $1,503,182 -12.0 -2.0
40 – Adirondack   10,246 10,331 11,922 -0.8 -14.1 $463,573 $456,379 $540,189 +1.6 -14.2
41 – Blue Water/International   7,219 5,914 5,856 +22.1 +23.3 $165,735 $154,189 $140,732 +7.5 +17.8
54 – Hoosier State   1,466 1,088 1,220 +34.7 +20.2 $23,590 $16,690 $10,540 +41.3 +123.8
56 – Kansas City-St. Louis   9,265 8,265 7,629 +12.1 +21.4 $217,125 $202,138 $162,997 +7.4 +33.2
57 – Pennsylvanian   11,972 10,912 10,442 +9.7 +14.7 $399,848 $385,461 $356,403 +3.7 +12.2
65 – Pere Marquette   6,278 4,277 4,719 +46.8 +33.0 $140,324 $102,798 $116,324 +36.5 +20.6
66 – Carolinian   21,393 23,607 20,077 -9.4 +6.6 $977,756 $1,149,343 $1,211,400 -14.9 -19.3
67 – Piedmont   2,833 2,585 2,515 +9.6 +12.6 $39,822 $33,006 $33,751 +20.7 +18.0
74 – Transbay Buses   $19,915 $25,922 $2,422 -23.2 +722.1
75 – Interline   $228,149 $407,334 $125,871 -44.0 +81.3
81 – Thruway Buses   $159,593 $203,925 $52,118 -21.7 +206.2
96/99 – Special Trains    2,965 8,675 3,480 -65.8 -14.8 $684,068 $709,162 $774,856 -3.5 -11.7
Short Distance Total 1,663,555 1,648,228 1,729,319 +0.9 -3.8 $71,509,593 $72,057,204 $78,257,672 -0.8 -8.6
Long Distance                            
16 – Silver Star   9,259 15,703 16,783 -41.0 -44.8 $701,490 $1,198,469 $1,626,679 -41.5 -56.9
17 – Three Rivers   11,343 10,949 10,071 +3.6 +12.6 $676,440 $650,451 $721,433 +4.0 -6.2
18 – Cardinal   6,712 5,237 5,320 +28.2 +26.2 $335,357 $221,514 $273,592 +51.4 +22.6
19 – Silver Meteor   10,512 16,794 17,233 -37.4 -39.0 $880,087 $1,381,315 $1,861,399 -36.3 -52.7
25 – Empire Builder   35,391 34,486 35,342 +2.6 +0.1 $3,520,062 $3,312,943 $3,429,697 +6.3 +2.6
26 – Capitol Ltd.   12,189 12,948 11,738 -5.9 +3.8 $825,638 $835,475 $868,207 -1.2 -4.9
27 – California Zephyr   25,940 26,513 27,034 -2.2 -4.0 $2,684,139 $2,838,903 $2,992,529 -5.5 -10.3
28 – Southwest Chief   22,283 23,503 24,116 -5.2 -7.6 $2,633,882 $2,642,661 $2,842,977 -0.3 -7.4
30 – City of New Orleans   13,787 13,368 13,326 +3.1 +3.5 $887,998 $739,701 $794,850 +20.0 +11.7
32 – Texas Eagle   15,704 15,833 16,620 -0.8 -5.5 $1,041,347 $1,046,876 $1,214,060 -0.5 -14.2
33 – Sunset Ltd.   4,565 7,543 7,946 -39.5 -42.5 $583,866 $894,060 $976,902 -34.7 -40.2
34 – Coast Starlight   32,517 35,802 36,656 -9.2 -11.3 $2,522,046 $2,603,744 $2,733,409 -3.1 -7.7
45 – Lake Shore Ltd.   21,458 21,838 20,490 -1.7 +4.7 $1,596,323 $1,581,381 $1,676,225 +0.9 -4.8
48 – Palmetto   9,607 13,620 14,050 -29.5 -31.6 $591,248 $862,135 $1,223,539 -31.4 -51.7
52 – Crescent   15,911 17,728 19,158 -10.2 -16.9 $1,401,643 $1,544,034 $1,896,829 -9.2 -26.1
63 – Auto Train   8,033 11,318 7,952 -29.0 +1.0 $1,721,015 $2,332,400 $2,770,564 -26.2 -37.9
Long Distance Total 255,211 283,183 283,835 -9.9 -10.1 $22,602,581 $24,686,060 $27,902,890 -8.4 -19.0
                               
Amtrak Total 1,918,766 1,931,411 2,013,154 -0.7 -4.7 $94,112,173 $96,743,263 $106,160,563 -2.7 -11.3
                               
Notes: – September FY04 ridership and ticket revenues reflect deferred ridership of 38,515 and deferred ticket revenues of $2,033,641.          
  – The data reflects new route definitions for FY04:                        
         1)  the Adirondack, Ethan Allen, Vermonter, Carolinian, & Texas Eagle include trips on the entire train, with subsequent adjustments to Empire, Regional and Chicago-St. Louis;
         2)  the Federal & Maple Leaf are included in Regional & Empire respectively.                  
                               
* Reflects revised September FY04 ridership and ticket revenue Budget at the route level.  No Budget change was made at the overall Amtrak level.        

Fall 2004 MARP member newsletter

Fall 2004 stories included:

  • The Blue Water is back! Initial ridership shows double digit increase
  • MARP member helps the “Train to the Tulips” return
  • Major revision of MARP bylaws proposed
  • Guest editorial: Making the connection between urban planning and homeland security
  • MARP wins long stuggle over platform heights
  • MARP works against anti-Amtrak bill
  • How about a cross border connection at Detroit?

Published quarterly, The Michigan Passenger serves as the official publication of the Michigan Association of Railroad Passengers. Copies of the publication can be found at every Amtrak station in the state of Michigan as well as locations having interest in passenger rail such as local libraries, hobby stores and city halls. To receive this publication at your home or business, you must become a member of MARP. Join by filling out the application in the About MARP section of this website.

MARP Excusion trip 2004

Michigan has many excursion, tourist, museum and dinner railroad operations available for purely recreational trips. Pictured above is an August 2004 excursion train to the Boyne Fall’s Polish Festival by Lake Central Railroad Tours. Power was provided by the Tuscola and Saginaw Bay Railway. (Photo by Larry Sobczak)