Click here for a PDF version: Ann Arbor to Traverse City Train Study Summary (2018)-1
or click on the images to enlarge:


Click here for a PDF version: Ann Arbor to Traverse City Train Study Summary (2018)-1
or click on the images to enlarge:
Comments on Michigan Mobility 2045
State Long Range Transportation Plan
submitted by
Michigan Association of Railroad Passengers (MARP)
John Guidinger, Chair
February 4, 2021
The Michigan Association of Railroad Passengers (MARP) is pleased to have this opportunity to comment on the Michigan Mobility 2045 State Long Range Transportation Plan.
Our comments follow the order of the subjects addressed in Item 4 in the agenda for our meeting and interview on this date. They are limited to passenger intercity rail, commuter rail, and Thruway bus matters. We are not addressing the currently severe effect of the virus pandemic on rail passenger service, because we believe this issue will be resolved soon.
OVERALL VISION
MARP wants to see a system of intercity trains that are modern, fast, reliable, and operate on frequent, regular-interval schedules to meet the travel needs of all passengers. On the corridor between Chicago and Detroit/Pontiac departures should be hourly or bi-hourly. The trains should connect all significant population centers in Michigan with other population centers in Michigan and centers throughout the United States and Canada. The system must be closely integrated with other means of public passenger travel to allow seamless transfer from one mode to the other and to promote travel into Michigan. We believe that the reduced dependency on road travel will bring enormous economic benefit to Michigan through the rejuvenation of the downtown areas of our cities, increased tourism, expansion of rail-oriented industry, and a less hectic lifestyle. These important societal advantages will accrue over road travel even when travel times are similar. Other advantages include reducing conflicts with urban and rural land uses, improving human mobility and convenience, reducing road congestion, decreasing the need for costly road expansion, increasing travel safety, conserving energy resources, reduction of impacts to air and water resources, and improving space utilization. We believe Michigan is in a unique position to optimize the return on assets from its ownership and previous investments in rail service, both passenger and freight.
CRITICAL PASSENGER ISSUES
Track and Right-of Way
Stations
Schedules and Frequency
Equipment
New Services
the operation of the Grand Canyon Railroad in Arizona and the Cumbres and Toltec Railroad in Colorado and New Mexico.
Northern Michigan
SUGGESTED MM 2045 PLAN CONTENTS AND MARP ASSISTANCE
MARP would like to see Final MM 2045 Plan contain:
Assistance to the Mission of MARP
Again, we sincerely appreciate the opportunity to provide our comments and suggestions for the MM 2045 Transportation Plan. Thank you
Click here for a PDF of the presentation: MDOT Update for MARP Meeting 2020.07.09
Or click on the images below to enlarge them:


At the January 14, 2012, meeting at the Williamston Depot Museum in Williamston, the MARP Executive Committee approved the attached Route Enhancement Recommendations. We are asking all members to review these recommendations and help us keep abreast of the many wonderful projects underway in Michigan. We particularly need volunteers to help us track what is happening in Battle Creek, Troy and the proposed improvements between Porter, Indiana, and Chicago Union Station.
Please relay any information you have to: Hugh Gurney
2270 Hickory Circle Drive
Howell, MI 48855
(517) 545-2979
hgurney@hsmichigan.org
a) Track status of implementation on a monthly basis.
b) Determine funding needed if PRIAA is implemented.
c) Establish communication links with MDOT, Amtrak, rail advocacy groups in affected states, & federal legislators to develop a unified position on actions needed, including rescinding of Section 209.
d) Investigate options to offset costs of PRIIA including extension of trains to Canada, the Eastern United States or points beyond Chicago on the West.
a) Work with TRU and other advocacy groups for the establishment of a Southeast Michigan Transportation Authority.
b) Find champions at the local, state and federal levels who will push for implementation of local commuter services.
c) Facilitate a steering group including business, community, advocacy and political leaders to educate the public on the value of commuter service and market the service.
d) Hold demonstration runs in 2012.
a) Work with MEC and TRANS4M to identify a funding source for these studies.
b) Create an RFP
c) Select a consulting firm to conduct the studies, possibly the one that did the Grand Valley study.
d) Review and approve findings.
e) Communicate findings to affected communities, MDOT and the Michigan legislature.
a) Meet with Indian Trails and other intercity carriers to identify needs.
b) Involve other advocacy groups including TRANS4M, MDOT and members of the Michigan legislature to secure an adequate level of funding.
c) Track expenditures once funding is secured.
a) Report quarterly to the Executive Committee.
b) Demand explanations and corrective actions if projects fall behind schedule.
a) Work with Indian Trails, MDOT, and Amtrak to identify and overcome obstacles to having all Indian Trails routes in Michigan identified as Amtrak Thruway Routes.
b) Identify funding required to institute new intercity motor coach routes including north from New Buffalo along the Lake Michigan shoreline and daytime service Marquette-Milwaukee.
c) Create website page with information about how to get around Michigan by train and bus.
a) Determine the level of funding needed for an adequate passenger rail system in Michigan.
b) Support TRANS4M in its efforts to secure adequate funding for all transportation modes.
c) Enlist all transportation and environmental groups in advocating for a balanced transportation system in Michigan.
d) Insist that a full 10% of transportation funding be dedicated to public transportation including rail as specified by the Michigan Constitution.
e) If passenger rail funding remains inadequate even with 10% of the state transportation funding dedicated to public transportation, identify additional funding possibilities.
Courtesy the National Association of Railroad Passengers:
There are a lot of conflicting statistics being thrown around in the debate taking place over what direction the U.S. transportation should take. NARP has done the work to defend passenger trains against the half-truths and flat-out inaccuracies being used by anti-rail groups.
[Special thanks to the OneRail coalition for contributing to this document.]
Any myths you’d like to see debunked? Any facts that sound fishy to you that you’d like NARP staff to investigate? If there are any additions or alterations you’d like to see to this document, simply email [narp]@[narprail.org] with your suggestions (Subject: Myths & Facts).
Myth: Unlike Europe, the US doesn’t have the population density to support high-speed rail, and can’t support passenger trains outside the Northeast Corridor.
Fact: The US population is actually clustered within megaregions: the Northeast, Midwest, Southeast, and California—precisely the areas where most high-speed and intercity passenger rail projects are advancing. It’s treated as a given that the Midwest is too sparsely populated to consider passenger train investment. However, the Midwest Megaregion (a region roughly bounded by Ohio, Missouri, Minnesota, and Michigan) encompasses a $2.6 trillion economy—the fifth largest in the world, behind only the U.S. itself, China, Japan, and Germany. California—currently designing and engineering a statewide high-speed rail network—compares favorably to Spain in terms of density with 88.1 people per square mile to Spain’s 89.6. And California beats Spain’s economic output with a per capita GDP of $49,894 to Spain’s $36,451.
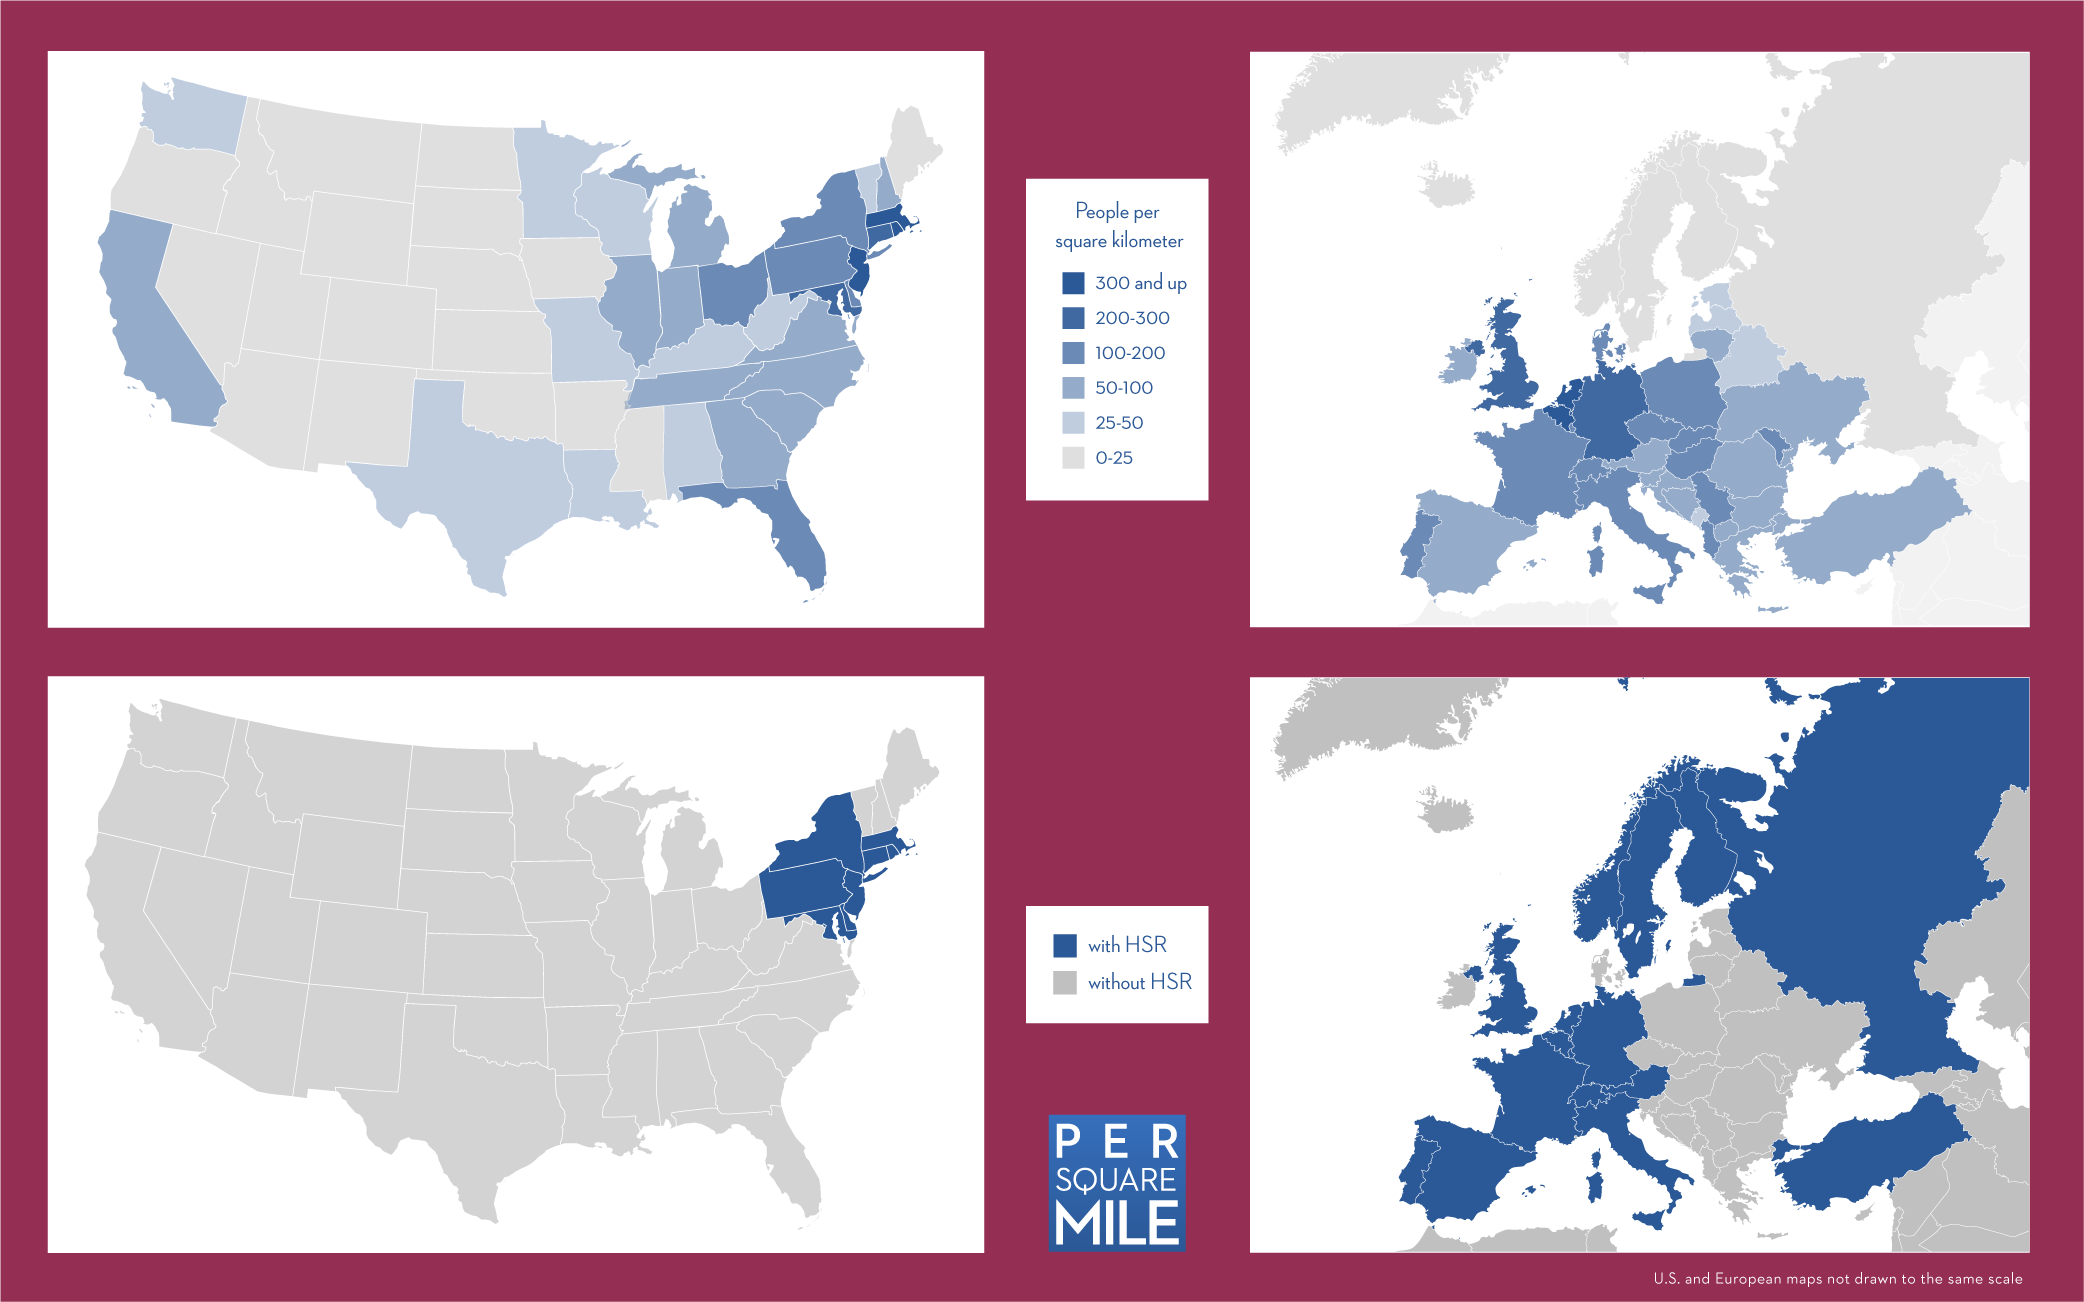 |
| Image: Per Square Mile compares U.S. and European density. |
With 130 million additional Americans expected by the year 2050, investing in rail lines to accommodate this growth will determine whether we are faced almost exclusively with sprawling, road-dependant suburbs or will the universe of livable, navigable communities grow substantially.
[The Economic Impacts of High-Speed Rail: Transforming the Midwest—2011. Midwest High-Speed Rail Association & Siemens]; [Matt Melzer, “If Spain can do it, we definitely can”, California High-Speed Rail Blog, July 31st, 2008]
Myth: “Far from protecting the environment, most rail transit lines use more energy per passenger mile, and many generate more greenhouse gases, than the average passenger automobile.” (Randal O’Toole, Cato Institute, April 2008)
Fact: Amtrak is 31.2% more efficient than automobiles, 33.5 % more efficient than personal trucks, and 13.8% more efficient than airplanes (on a Btu per passenger mile basis). And the U.S. saves 4.2 billion gallons of oil each year through the use of public transportation. To get a more complete picture of the environmental impact of rail transit of all forms, one must take into account the extent to which rail serves as a catalyst for energy-efficient, pedestrian-friendly real estate development and thus also energy-efficient buildings.
[Transportation Energy Data Book: Edition 30—2011. Oak Ridge National Laboratory.]; [Public Transportation Fact Book—2011. American Public Transportation Association]
Myth: “The train’s only advantage is for people going from downtown to downtown. Who works downtown? Bankers, lawyers, government officials, and other high-income people who hardly need subsidized transportation.” (Randal O’Toole, Cato Institute, July 2009)
Fact: Amtrak’s long-distance trains provide service to many communities with few-to-no alternatives, and long-distance coach passengers are the lowest-income segment of Amtrak’s markets. The Empire Builder alone carried 533,000 passengers in fiscal year 2010. The route has very limited bus and air service alternatives and no parallel interstate highway most of the way. Extreme winter weather conditions frequently close highways and airports. Senior citizens accounted for 38% of adult passengers on the long-distance trains in FY2010. Of all Amtrak riders requiring accessibility, 42% use the long-distance trains. Paying to provide highway and air alternatives for these special-needs populations would be far more expensive than maintaining Amtrak service.
[Long Distance Train Facts—2011. Amtrak.]
Myth: The taxpayers pay Amtrak subsidies because the railroad loses so much on sleeper rooms and dining service.
Fact: Sleeping car passengers pay much higher fares than other passengers. Though they account for only 15% of long-distance riders, they are the source for 36% of the total revenue. Since the average coach traveler rides for more than 10 hours, providing access to food is essential for a functioning train service. Amtrak has simplified its offerings and implemented point-of-sale systems to enhance cost efficiencies.
[Long Distance Train Facts—2011. Amtrak.]
Myth: “Gasoline taxes and highway tolls built and maintain intercity roadways, and they also support mass transit with $10 billion in subsidies annually….Only rail requires heavy subsidies.” (Wendell Cox, The Wall Street Journal, ‘The Runaway Subsidy Train,’ January 31, 2010)
Fact: The amount that government has spent on highways, roads, and streets has exceeded the amount raised through gasoline taxes and other user fees by $600 billion (in 2005 dollars). Since 2008, Congress has transferred $34.5 billion in U.S. Treasury general funds to the highway trust fund.
Generally, highways cover only 51% of the total associated costs through user-fees, because the federal highway program focuses on new-build and leaves states to worry about maintenance. Compare that to the 75% of Amtrak operating costs and 53% of commuter rail operating costs covered by ticket revenues.
[Do Roads Pay For Themselves?: Setting the Record Straight on Transportation Funding—2011. U.S. Public Interest Research Group.]
Myth: The only way to decrease traffic is to build more roads.
Fact: A recent study by the University of Toronto found that building more roads leads to more congestion. As you increase capacity, new drivers will move in to take up that freed capacity until traffic becomes so onerous that people look for other alternatives. The equilibrium point for urban roads will always be congestion.
“In particular, if you had one percent more roads, you had one percent more driving in those cities” says Matthew Turner, a co-author of the study.
The only method known to effectively decrease traffic is congestion pricing, where drivers are charged on a variable scale based on zone and time (i.e. driving downtown during rush hour will be the most expensive).
[The fundamental law of road congestion: Evidence from the US. Gilles Duranton and Matthew A. Turner. 2011.]
Myth: “So how is California’s fabulous high-speed rail project between LA and San Francisco going? You know, the one approved by California’s fabulous voters as part of California’s fabulous initiative process. Well, a new estimate for the nice, easy part between Merced and Bakersfield puts the cost at $10-$14 billion, up from earlier estimates of $6.8 billion made a mere three years ago…” (Kevin Drum, Mother Jones, “California’s HSR Boondoggle Now Even More Boondoggly”, August 11, 2011)
Fact: An initiative is a ballot measure placed on the ballot by the voters. In truth, the California high-speed rail project measure was placed on the ballot by a two-thirds vote in both houses of the Legislature and granted final approval by the (Republican) Governor, pursuant to the constitutional requirement for approval of general obligation bond measures.
And as of this summer, the low-end estimate for the entire San Francisco-Los Angeles-Anaheim route has only been increased by $3 billion from the 2009 estimate of $43 billion.
A peer review committee, convened by the California High-speed Rail Authority specifically to address questions about ridership projections, deemed the ridership model a solid foundation for project planning: “We are satisfied with the documentation presented in Cambridge Systematics, and conclude that it demonstrates that the model produces results that are reasonable and within expected ranges for the current environmental planning and Business Plan applications of the model. We were very pleased with the content, quality and quantity of the information.”
[Independent Peer Review of the California High-Speed Rail Ridership and Revenue Forecasting Process: Findings and Recommendations from April-July 2011 Review Period—2011. ]
Myth: High-speed rail in California will destroy huge amounts of farmland and lead to urban sprawl.
Fact: California is projected to add around 25 million people by the year 2050, bringing its total population to around 60 million people. If the state didn’t build the high-speed line, transportation officials estimate California would need to spend an estimated $100 billion on 3,000 miles of new freeways, five new airport runways, and build 90 new departure gates through airport expansion or new construction.
Modern rail corridors are actually the cheapest, most land-efficient way to accommodate all the traveling Americans will need to do in the coming century. By creating hubs for intercity transportation in city- and town-centers, passenger trains create denser, safer, more pedestrian-friendly communities for families.
[Merced to Fresno Section of the California High-Speed Train System: Highlights of Draft Environmental Impact Report/Statement—2011. Prepared for the California High Speed Rail Authority and the US Department of Transportation Federal Railroad Administration.]
Myth: “Let’s face it, now is not the time to be spending a decent size country’s GDP on a fast train between Los Angeles and San Francisco. Instead we should be spending that fortune completing much needed regional mass transit systems for Los Angeles, San Diego, Anaheim, Irvine, San Jose, the Bay Area, Bakersfield, Fresno and Sacramento.” (“California’s High-Speed Rail Mistake”, Huffington Post, September 13, 2011)
Fact: The state of California’s GDP is $2 trillion. The United State’s GDP is around $14 trillion. The money we are spending on high-speed rail—and even the total cost of the project in California—is a tiny fraction of that. And a drop in the bucket compared to the hundreds of billions the U.S. spends on roads and highways.
Additionally, the funds are not interchangeable. This claim is often made by people who want to see Amtrak and high-speed rail killed, knowing that once the money is rescinded there’s little chance that Congress would redirect the money to increase spending on transit. By ignoring intercity transportation we would be chaining ourselves to automobiles, freeways, and airplanes—dramatically increasing our energy consumption and CO2 emissions. America needs both intercity rail and intracity transit.
The U.S. invests about 2.4% of GDP on transportation and water infrastructure. Europe invests 5% of its GDP by comparison, with China sprinting ahead at 9%. It’s no wonder that American Society of Civil Engineers’ 2009 Report Card for America’s Infrastructure graded the nation’s critical infrastructure systems a “D”, noting a five-year investment need of $2.2 trillion to bring U.S. infrastructure up to par.
[Gross State Product—2011. Greyhill Advisors.][“Life in the slow lane”, Economist, April 28, 2011]; [Report Card for America’s Infrastructure—2009. American Society of Civil Engineers.]